
This following link is a great online tool for studying Regression Methods from Penn State:
https://onlinecourses.science.psu.edu/stat501/node/2
SIMPLE LINEAR REGRESSION
The least squares line, also called the line of best fit, is the line which minimises the sum of the squared residuals. It characterises the relationship between two numerical variables. The linear regression line equation is based on the equation of a line in mathematics.


COEFFICIENT OF DETERMINATION
R-squared gives us the proportion of the total variability in the response variable (Y) that is “explained” by the least squares regression line based on the predictor variable (X). It is usually stated as a percentage. The higher the value of the coefficient of determination, the better the least squares regression line is in explaining the information (variation) in the data.
Interpretation: On average, …..% of the variation in the dependent variable can be explained by the independent variable through the regression model.
INTERPRETATION OF THE INTERCEPT
The intercept βo represents the predicted value of the response variable y if the explanatory variable x is zero. The interpretation may be nonsensical since it is often not reasonable for the explanatory variable to be zero. As “x” is zero, the response variable is ….. If zero is not in the given sample x range then the intercept cannot be interpreted because 0 is outside of the sample range. Avoid trying to apply a regression line to predict values far from those that were used to create it.
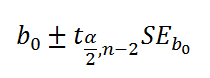
CONFIDENCE INTERVAL FOR THE INTERCEPT β0
INTERPRETATION OF THE SLOPE
The slope β1 represents the predicted change in the response variable y given a one unit increase in the explanatory variable x.
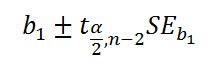
CONFIDENCE INTERVAL FOR THE SLOPE β1
TESTING THE SIGNIFICANCE OF THE SLOPE or REGRESSION LINE

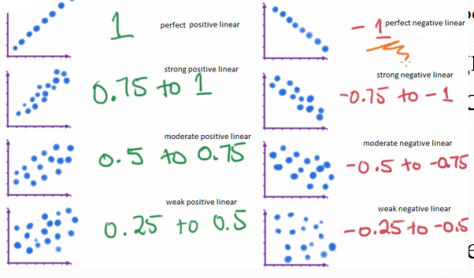
STRENGTH AND DIRECTION OF A CORRELATION
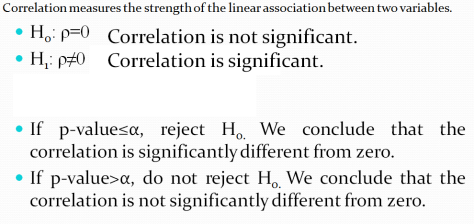
TESTING THE CORRELATION
TEST FOR NORMALITY
Ho: Data is normally distributed
Ha: Data is not normally distributed
If p-value≤α reject Ho. Data is not normally distributed at the α% level of significance.
If p-value>α do not reject Ho. Data is normally distributed at the α% level of significance.
TYPES OF MODELS

